
Summary: Abatement cost measures how much it costs to avoid one tonne of greenhouse gas emissions. A reliable assessment includes capital spending, operating changes, avoided expenses, project lifetime, and the emissions baseline. Used carefully, it supports investment and carbon-market decisions, but it should not replace integrated analysis of timing, technology, and sector interactions.
A project that cuts emissions can create savings, require a substantial investment, or do both at different stages. To understand the difference, you need a consistent measure of cost per tonne avoided. Our marginal cost of abatement curve guide provides further context for ranking reduction options.
Abatement cost is useful because it translates technical action into an economic metric. However, the result depends on the baseline, time horizon, discount rate, energy prices, technology assumptions, and the level of reduction being pursued. A low figure can identify an attractive opportunity, but it does not automatically make that option suitable for a long-term decarbonization strategy.
What does abatement cost measure?
Abatement cost is the additional cost of reducing one tonne of greenhouse gas emissions compared with a defined business-as-usual scenario. It is usually expressed in currency per tonne of carbon dioxide equivalent, such as dollars per tonne or euros per tonne.
The basic calculation is:
Abatement cost = net additional project cost ÷ tonnes of emissions avoided
Net additional project cost may include equipment, construction, engineering, financing, maintenance, energy use, labor, monitoring, and compliance expenses. It can also include savings from lower fuel consumption, reduced waste, recovered materials, or captured methane sold as a product.
This explains why an abatement cost can be negative. If a project reduces emissions and produces greater operating savings than its additional costs, the project has a net economic benefit. Energy-efficiency upgrades, fuel recovery, and process improvements can sometimes fall into this category, although the result depends on local prices and operating conditions.
The term is often used interchangeably with marginal abatement cost, but the concepts are not identical. Average abatement cost divides the total net project cost by total tonnes avoided. Marginal abatement cost measures the cost of avoiding the next additional tonne, or the next increment of reduction.
How do you calculate abatement cost correctly?
Imagine an industrial operator is considering a process upgrade. The project requires $2 million in additional investment and operating costs over its lifetime. It is expected to avoid 20,000 tonnes of CO2 equivalent.
The simple result is $100 per tonne. That figure is only meaningful if the calculation uses a credible baseline and includes the project’s full economic effects. If the upgrade also saves $600,000 in energy costs, the net cost falls to $1.4 million. The resulting abatement cost becomes $70 per tonne.
A robust calculation should define at least six elements:
- Baseline emissions: What would emissions have been without the project?
- Project emissions: Does the new equipment consume electricity, fuel, or materials that create additional emissions?
- Capital costs: What must be spent on equipment, construction, engineering, and commissioning?
- Operating costs: How will maintenance, labor, energy, and monitoring change?
- Project lifetime: Over how many years will the investment create reductions?
- Discount rate: How are future costs and savings converted into present values?
You should also test the calculation against realistic scenarios. A change in electricity prices can affect an electrification project. A change in the carbon intensity of the grid can affect the emissions benefit. Production volumes can change the number of tonnes avoided, while equipment downtime can reduce the financial return.
This is why quoting a single number without assumptions can be misleading. Two analysts can assess the same technology and reach different results because they use different baselines, carbon intensities, financing assumptions, or operating periods.
Why does marginal abatement cost rise as reductions deepen?

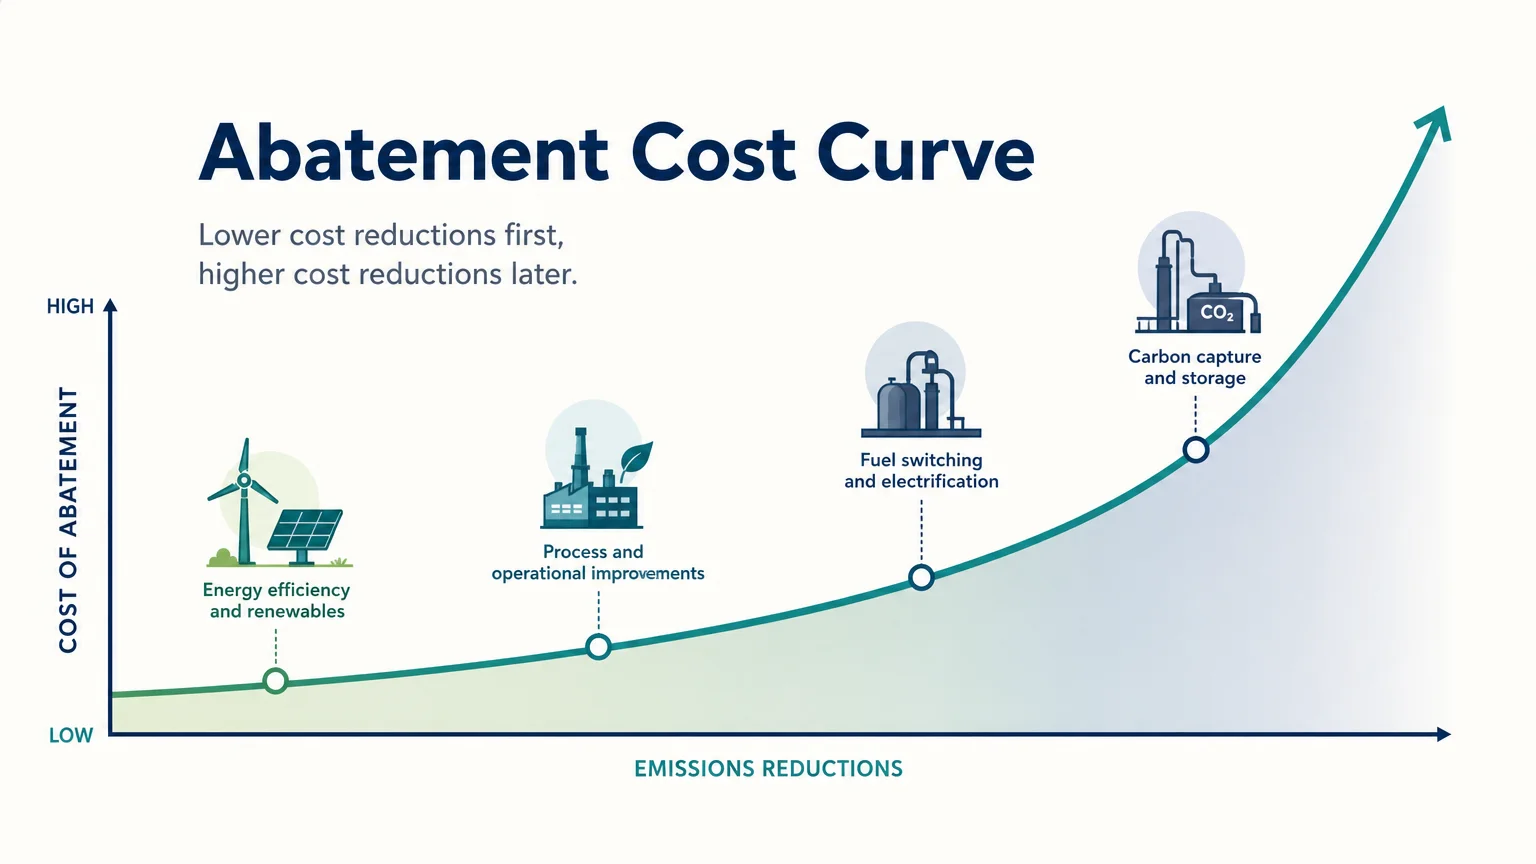
The first reduction opportunities are often relatively accessible. They may involve maintenance, energy efficiency, leak detection, fuel switching, or process controls. As the reduction target becomes more ambitious, the remaining emissions can become harder and more expensive to address.
This creates an upward-sloping marginal abatement cost curve. The horizontal axis represents additional emissions reductions. The vertical axis represents the cost of achieving the next reduction increment. Low-cost or negative-cost measures appear first, while complex technologies and structural changes appear later.
For example, an operator may reduce emissions through improved insulation before replacing an entire production line. It may then switch fuels before adopting a new process chemistry. Each step can require more capital, longer planning, new infrastructure, or greater operational risk.
The curve can also contain steps rather than a smooth line. A single project may deliver a large volume of reductions at a fairly stable cost. The next project may be much more expensive because it depends on new networks, specialist equipment, or technologies that are still developing.
In practice, marginal costs vary by sector. Methane reductions at an oil and gas facility may involve leak detection, equipment replacement, vapor recovery, or improved operating procedures. Deep reductions in cement, steel, aviation, and chemicals may require process transformation rather than incremental efficiency.
For a closer explanation of how the metric works in market and investment analysis, you can consult our marginal abatement costs guide.
What does recent research reveal about cost differences?
Abatement cost is not a universal price. It changes across locations, technologies, firms, pollutants, and reduction targets. Recent research illustrates how wide that variation can be.
In January 2026, the United States Environmental Protection Agency published a state-level non-CO2 mitigation report. The EPA mitigation dataset uses marginal abatement cost curves to show differences in mitigation potential and cost between states.
The geographic dimension matters because facilities operate under different energy prices, infrastructure conditions, regulations, labor markets, and resource availability. A methane project that is financially attractive in one region may be less attractive elsewhere.
Sector variation can be equally significant. A study published in Energy Policy in May 2026 estimated an average marginal CO2 abatement cost of USD 59.54 per tonne for India’s thermal power sector. The same study reported that raising carbon-intensity reductions to 45% by 2030 increased estimated abatement costs by 30%, showing how ambition affects the marginal cost of reduction. These are study-specific findings, not a global benchmark. You can review the 2026 power-sector study for its methodology and assumptions.
Pollutant type also changes the analysis. Methane abatement may produce financial value when captured gas can be sold, while carbon dioxide reductions may depend more heavily on energy prices, technology costs, or policy incentives.
How does abatement cost interact with carbon-market prices?
In a regulated emissions market, an operator can compare its internal abatement cost with the price of an allowance. If reducing one tonne internally costs less than purchasing an allowance, internal abatement may be financially attractive. If the internal cost is higher, purchasing an allowance may be cheaper in the short term.
Consider a hypothetical operator with an internal abatement cost of $90 per tonne. If the relevant allowance costs $70, buying the allowance may reduce immediate compliance expenditure. If the allowance costs $110, the operator may have an economic incentive to reduce emissions internally.
This comparison is useful, but it should not be treated as a complete investment decision. Allowance prices can change. Projects can create operating savings, protect against future regulation, reduce exposure to energy prices, or improve access to customers and finance.
The comparison also depends on the type of obligation. A compliance entity may need allowances regardless of its long-term investment plans. A financial participant may instead evaluate the relationship between allowance prices, expected volatility, liquidity, and future policy developments.
For professionals working with EU Allowances, our marginal abatement curve explanation connects reduction economics with carbon-market decision-making.
Recent methane analysis also demonstrates why a market comparison must consider the shape of the curve. The International Energy Agency published a 2026 chart based on its 2025 methane analysis, showing marginal cost by policy type for oil and gas methane abatement. The IEA cost curve reinforces that different measures can deliver different reduction volumes at different cost levels.
What are the main limitations of abatement cost?
A cost-per-tonne metric can simplify a complex transition. It should therefore be used as one input within a wider assessment.
It can ignore interactions between projects
Projects do not always operate independently. The value of electric vehicles depends partly on the electricity system. The benefit of a heat pump depends on the carbon intensity of the power supply. Industrial electrification can increase demand for clean generation and grid capacity.
It can undervalue timing
A project with a high current cost may be necessary because it requires years to scale. Delaying building renovations, grid upgrades, or industrial conversion can concentrate work later and increase labor, financing, and supply-chain pressure.
It can hide non-climate benefits
Lower emissions may accompany better air quality, lower exposure to volatile fuel prices, improved productivity, or stronger operational resilience. A narrow abatement cost calculation may not capture these benefits.
It can rely on uncertain baselines
The result changes when the business-as-usual scenario changes. If production expands, emissions avoided may increase. If a facility would have adopted a technology anyway, the incremental reduction attributed to the project may be smaller.
It can mislead when negative costs are included
A negative-cost project appears highly attractive, but firms may still fail to adopt it. Barriers can include limited capital, competing priorities, information gaps, split incentives, operational disruption, or uncertainty about performance.
A 2026 Resources for the Future analysis of roughly 2,150 orphaned oil and gas well sites found that decommissioning costs exceeded estimated social benefits in 75% to 80% of the cases where methane emissions were quantified. The analysis also found that targeting wells with higher environmental impacts could improve the cost-benefit result. The RFF well-decommissioning analysis illustrates why project selection matters as much as average cost.
How should you use abatement cost in a decision process?
Start by defining the decision you are trying to make. Are you selecting projects within a fixed budget, preparing for a compliance obligation, evaluating a new technology, or comparing allowance purchases with internal reductions?
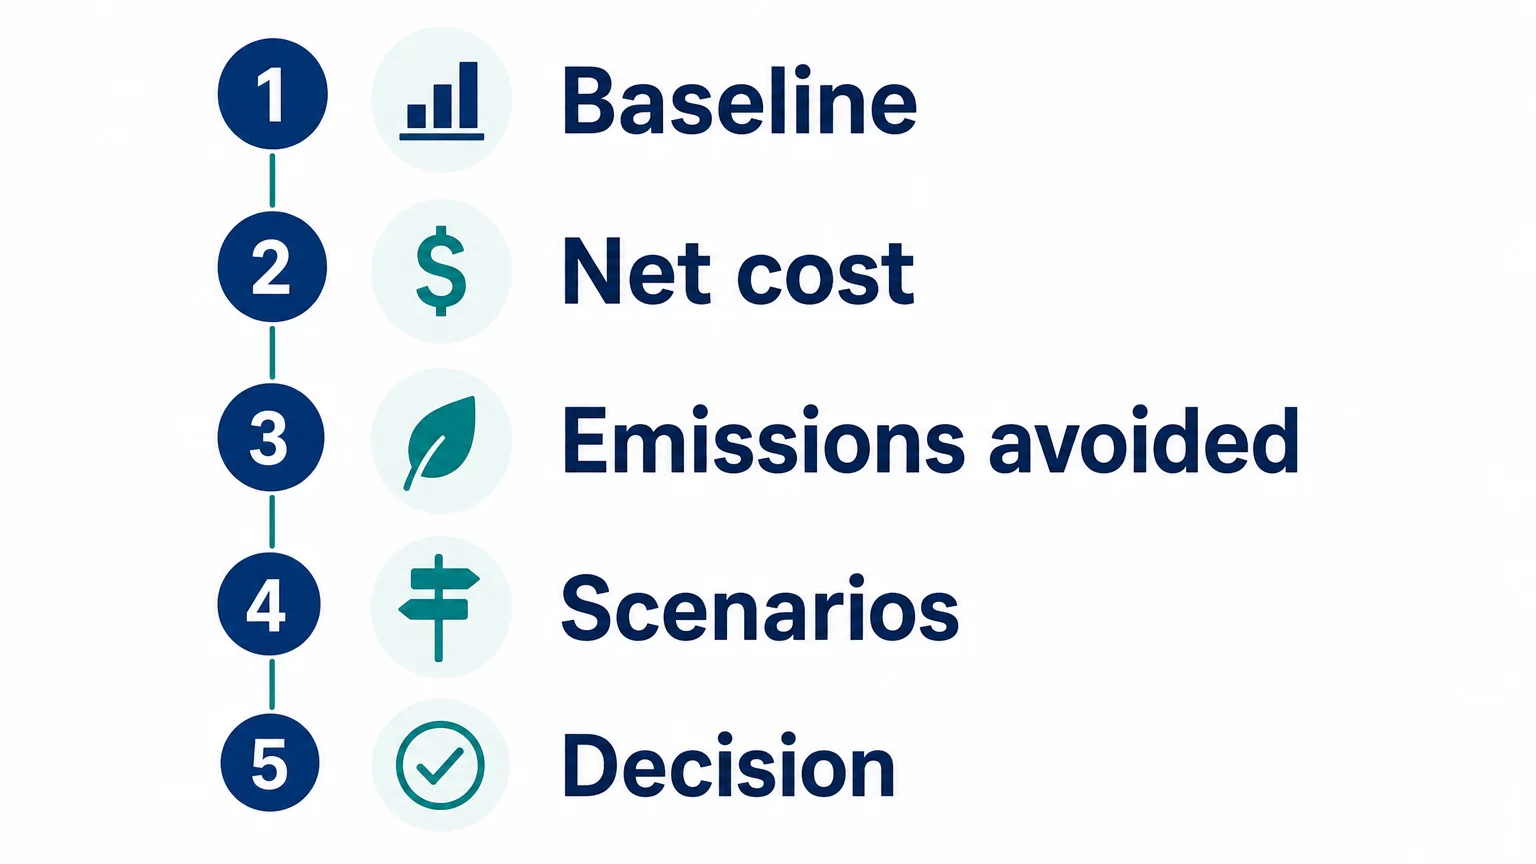
- Set the baseline: Document expected production, energy use, emissions, and operating conditions without the project.
- Define the reduction boundary: Specify whether the analysis covers Scope 1, Scope 2, methane, carbon dioxide, or total CO2 equivalent.
- Calculate the full net cost: Include capital spending, operating changes, savings, financing, monitoring, and expected project lifetime.
- Test scenarios: Vary energy prices, allowance prices, production levels, technology performance, and carbon intensity.
- Rank options carefully: Use marginal cost to compare the next reduction, but assess strategic projects separately.
- Review delivery constraints: Consider permitting, skilled labor, infrastructure, procurement timelines, and operational downtime.
- Connect the result to execution: Convert the analysis into procurement, trading, risk, reporting, and investment actions.
For carbon-market participants, execution quality is part of the economic decision. A theoretically attractive project can lose value if procurement is delayed, allowance exposure is poorly monitored, or the organization cannot manage positions and limits effectively.
Our abatement curve resource explains how to read an abatement curve when comparing reduction volumes, project costs, and market choices. The key principle is to treat the curve as decision support, not as a substitute for operational judgment.
How can you make the metric more decision-useful?
The most useful analysis combines three layers. The first is the project economics, which measure direct cost and emissions avoided. The second is the system context, which captures infrastructure, technology development, timing, and interactions with other sectors.
The third is execution. This includes the ability to procure allowances, monitor market exposure, manage cash and collateral, document transactions, and coordinate decisions across compliance, finance, procurement, and trading teams.
These layers help distinguish an attractive project from an actionable one. They also clarify whether the right response is immediate internal abatement, staged investment, allowance procurement, a hedge, or a combination of approaches.
For example, an industrial operator may identify a long-term process conversion with a high initial abatement cost. It may still begin with lower-cost efficiency measures, use allowances during the transition, and schedule procurement around expected compliance needs. This approach preserves flexibility while preparing for deeper reductions.
Use abatement cost with context
Abatement cost is a practical way to compare emissions-reduction options, but its value depends on the quality of the assumptions behind it. You should distinguish average from marginal cost, include operating savings and project timing, test uncertainty, and account for technology, infrastructure, and policy interactions. For carbon-market decisions, compare internal reduction economics with allowance exposure, then connect the result to disciplined execution and risk management.
Take action with Initiativ
Once you have assessed reduction costs, you may need a clearer way to manage allowance procurement, market exposure, and trading decisions. A connected workflow can help your team move from analysis to controlled execution.

We provide Carbon trading solutions for traders and corporates, including EUA spot and derivatives access, live price monitoring, configurable alerts, pre-trade risk controls, API connectivity, position management, reporting, confirmation, and settlement workflows. Our platform supports professional participants that need structured access to EU carbon markets and coordinated oversight across trading and procurement teams.
Frequently Asked Questions
What is abatement cost?
Abatement cost is the net cost of avoiding one tonne of greenhouse gas emissions compared with a defined baseline. It can be positive when reduction requires additional spending or negative when operating savings exceed project costs.
What is the difference between abatement cost and marginal abatement cost?
Abatement cost often refers to the average cost across an entire project or reduction program. Marginal abatement cost refers to the cost of achieving the next additional unit of emissions reduction.
Why can abatement cost be negative?
A project can have a negative cost when energy savings, recovered materials, avoided maintenance, or other financial benefits exceed the investment and operating expenses. The result depends on the selected baseline, project lifetime, and assumptions about future prices.
How does abatement cost affect carbon-market decisions?
Organizations can compare the cost of reducing emissions internally with the cost of purchasing allowances. We support this type of professional workflow through EUA spot and derivatives trading, live market information, risk controls, and position management.
Can abatement cost be used alone to choose a climate project?
No. You should also consider timing, technology readiness, infrastructure, implementation risk, co-benefits, compliance requirements, and interactions with other sectors. A higher-cost project may still be necessary for deep decarbonization or long-term resilience.